5 - Socioeconomic environment

5.2 – Economy

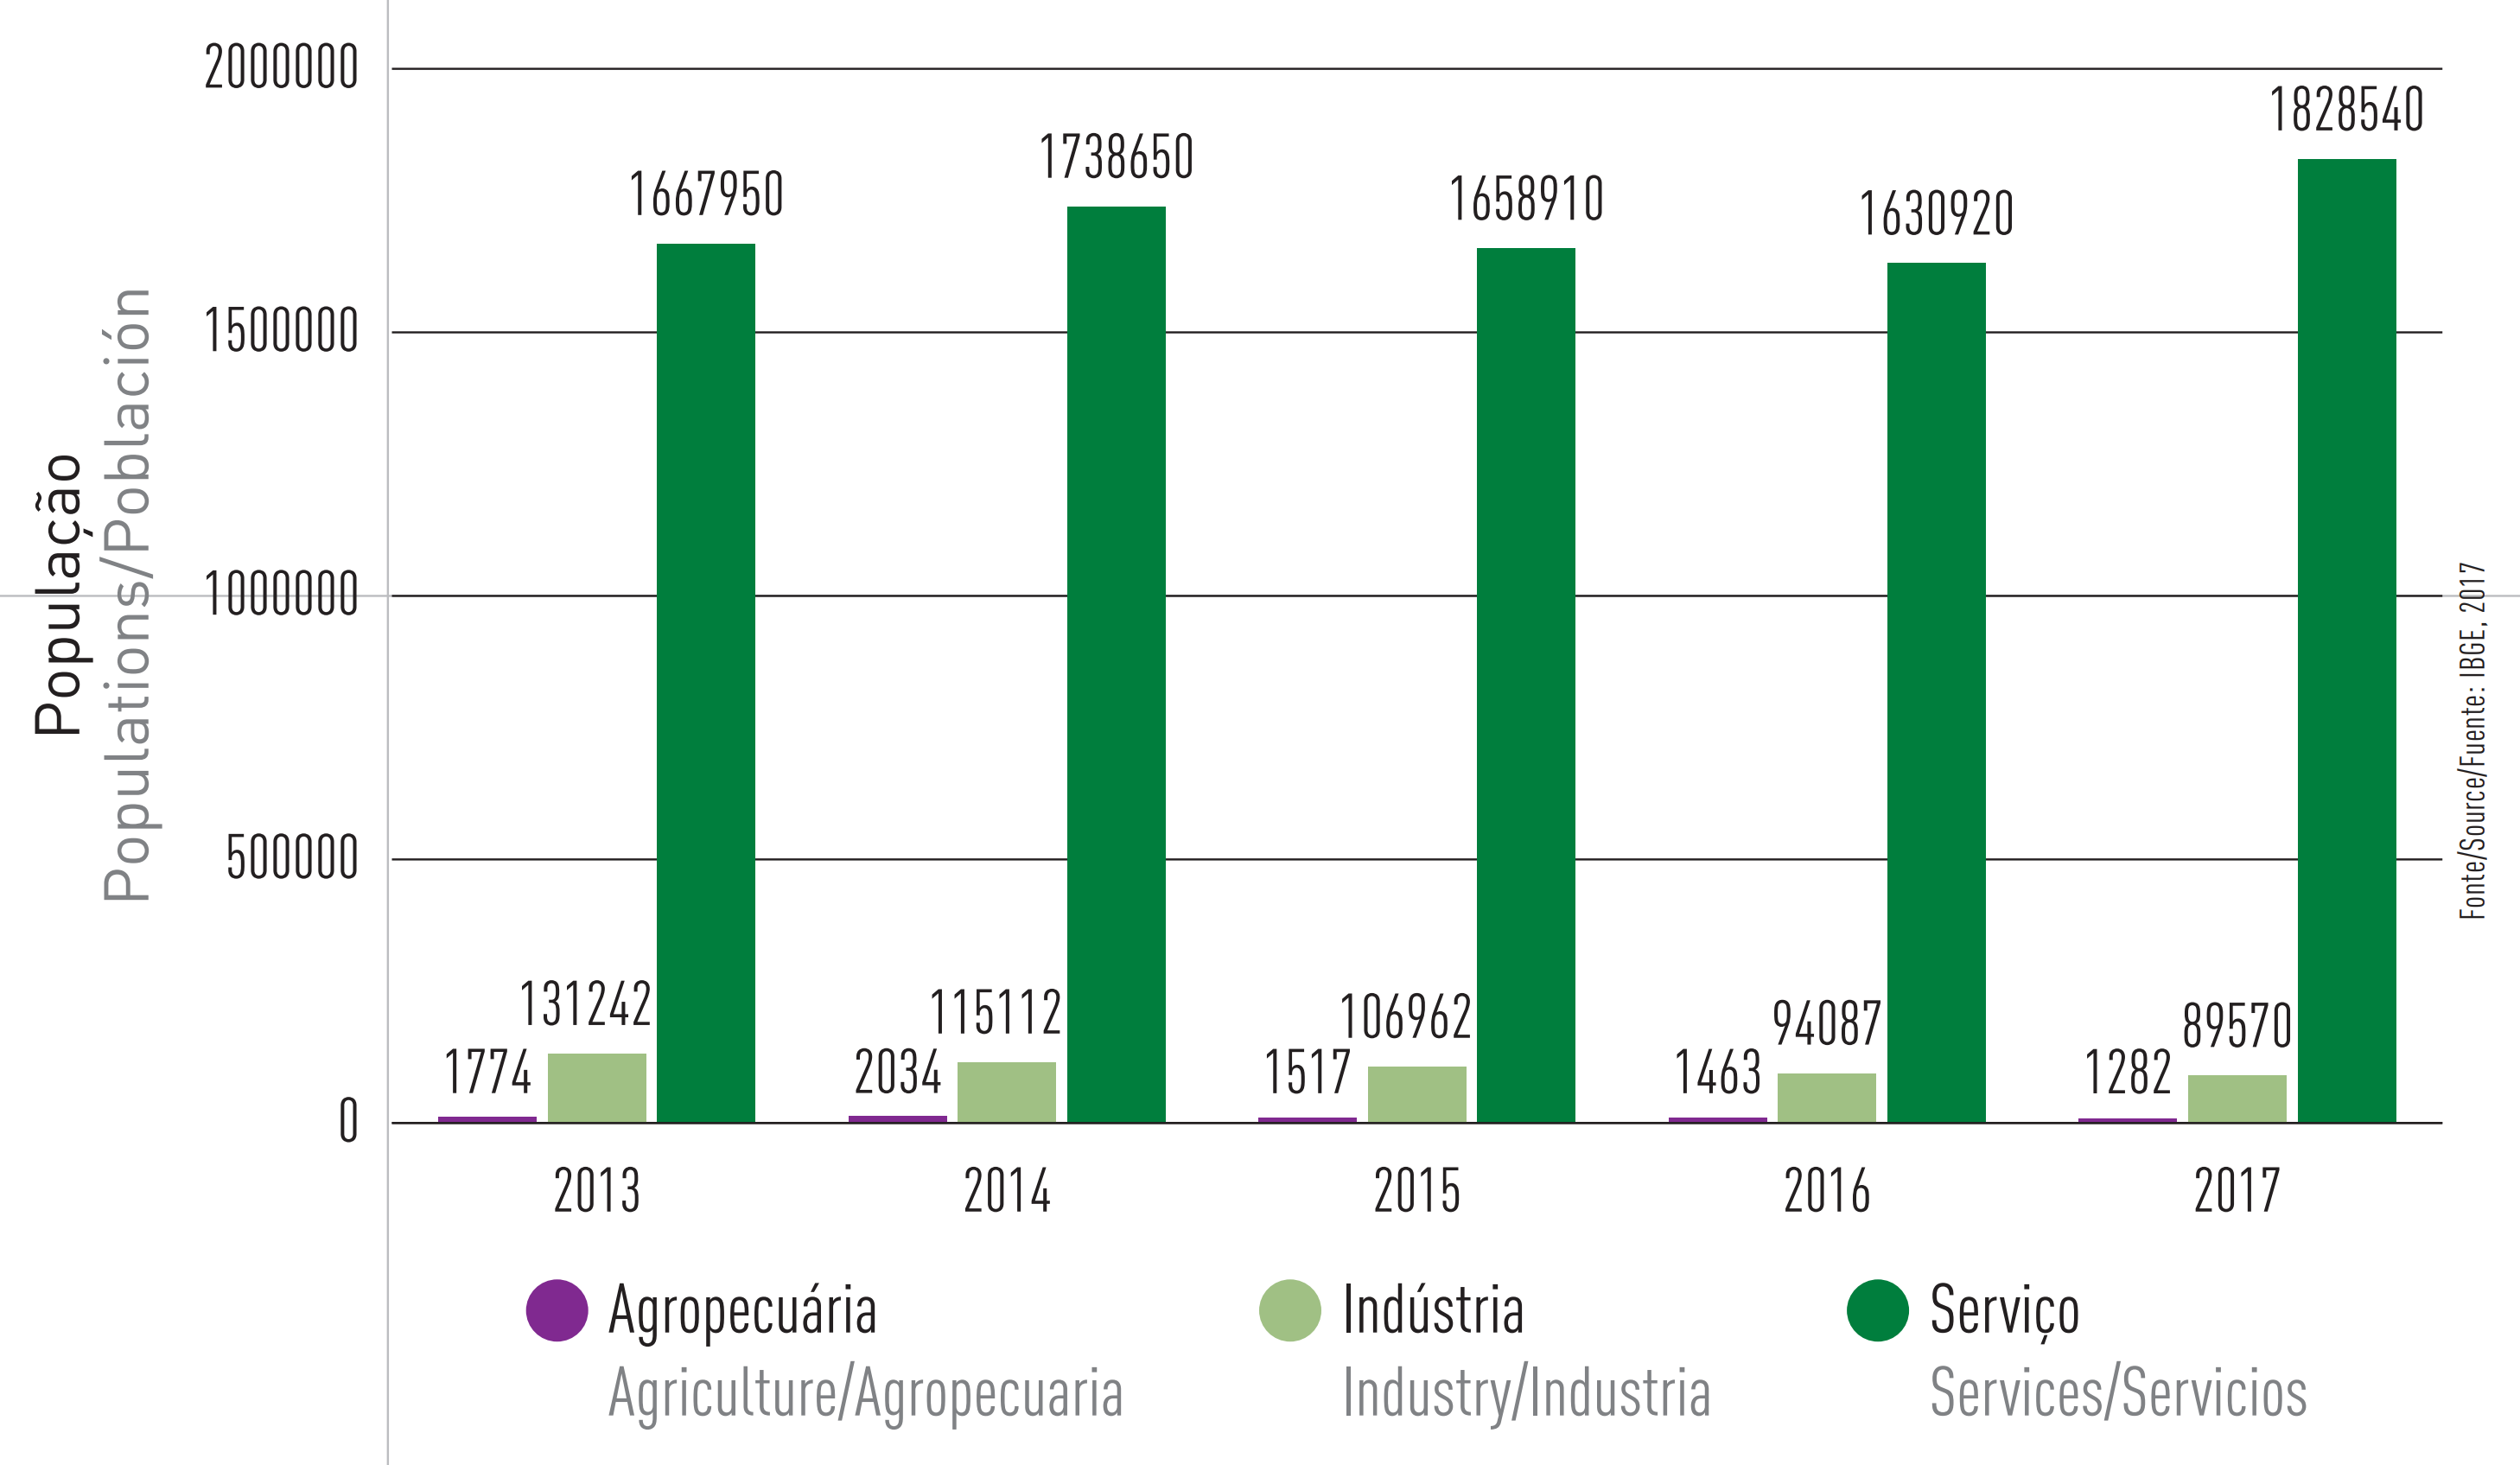
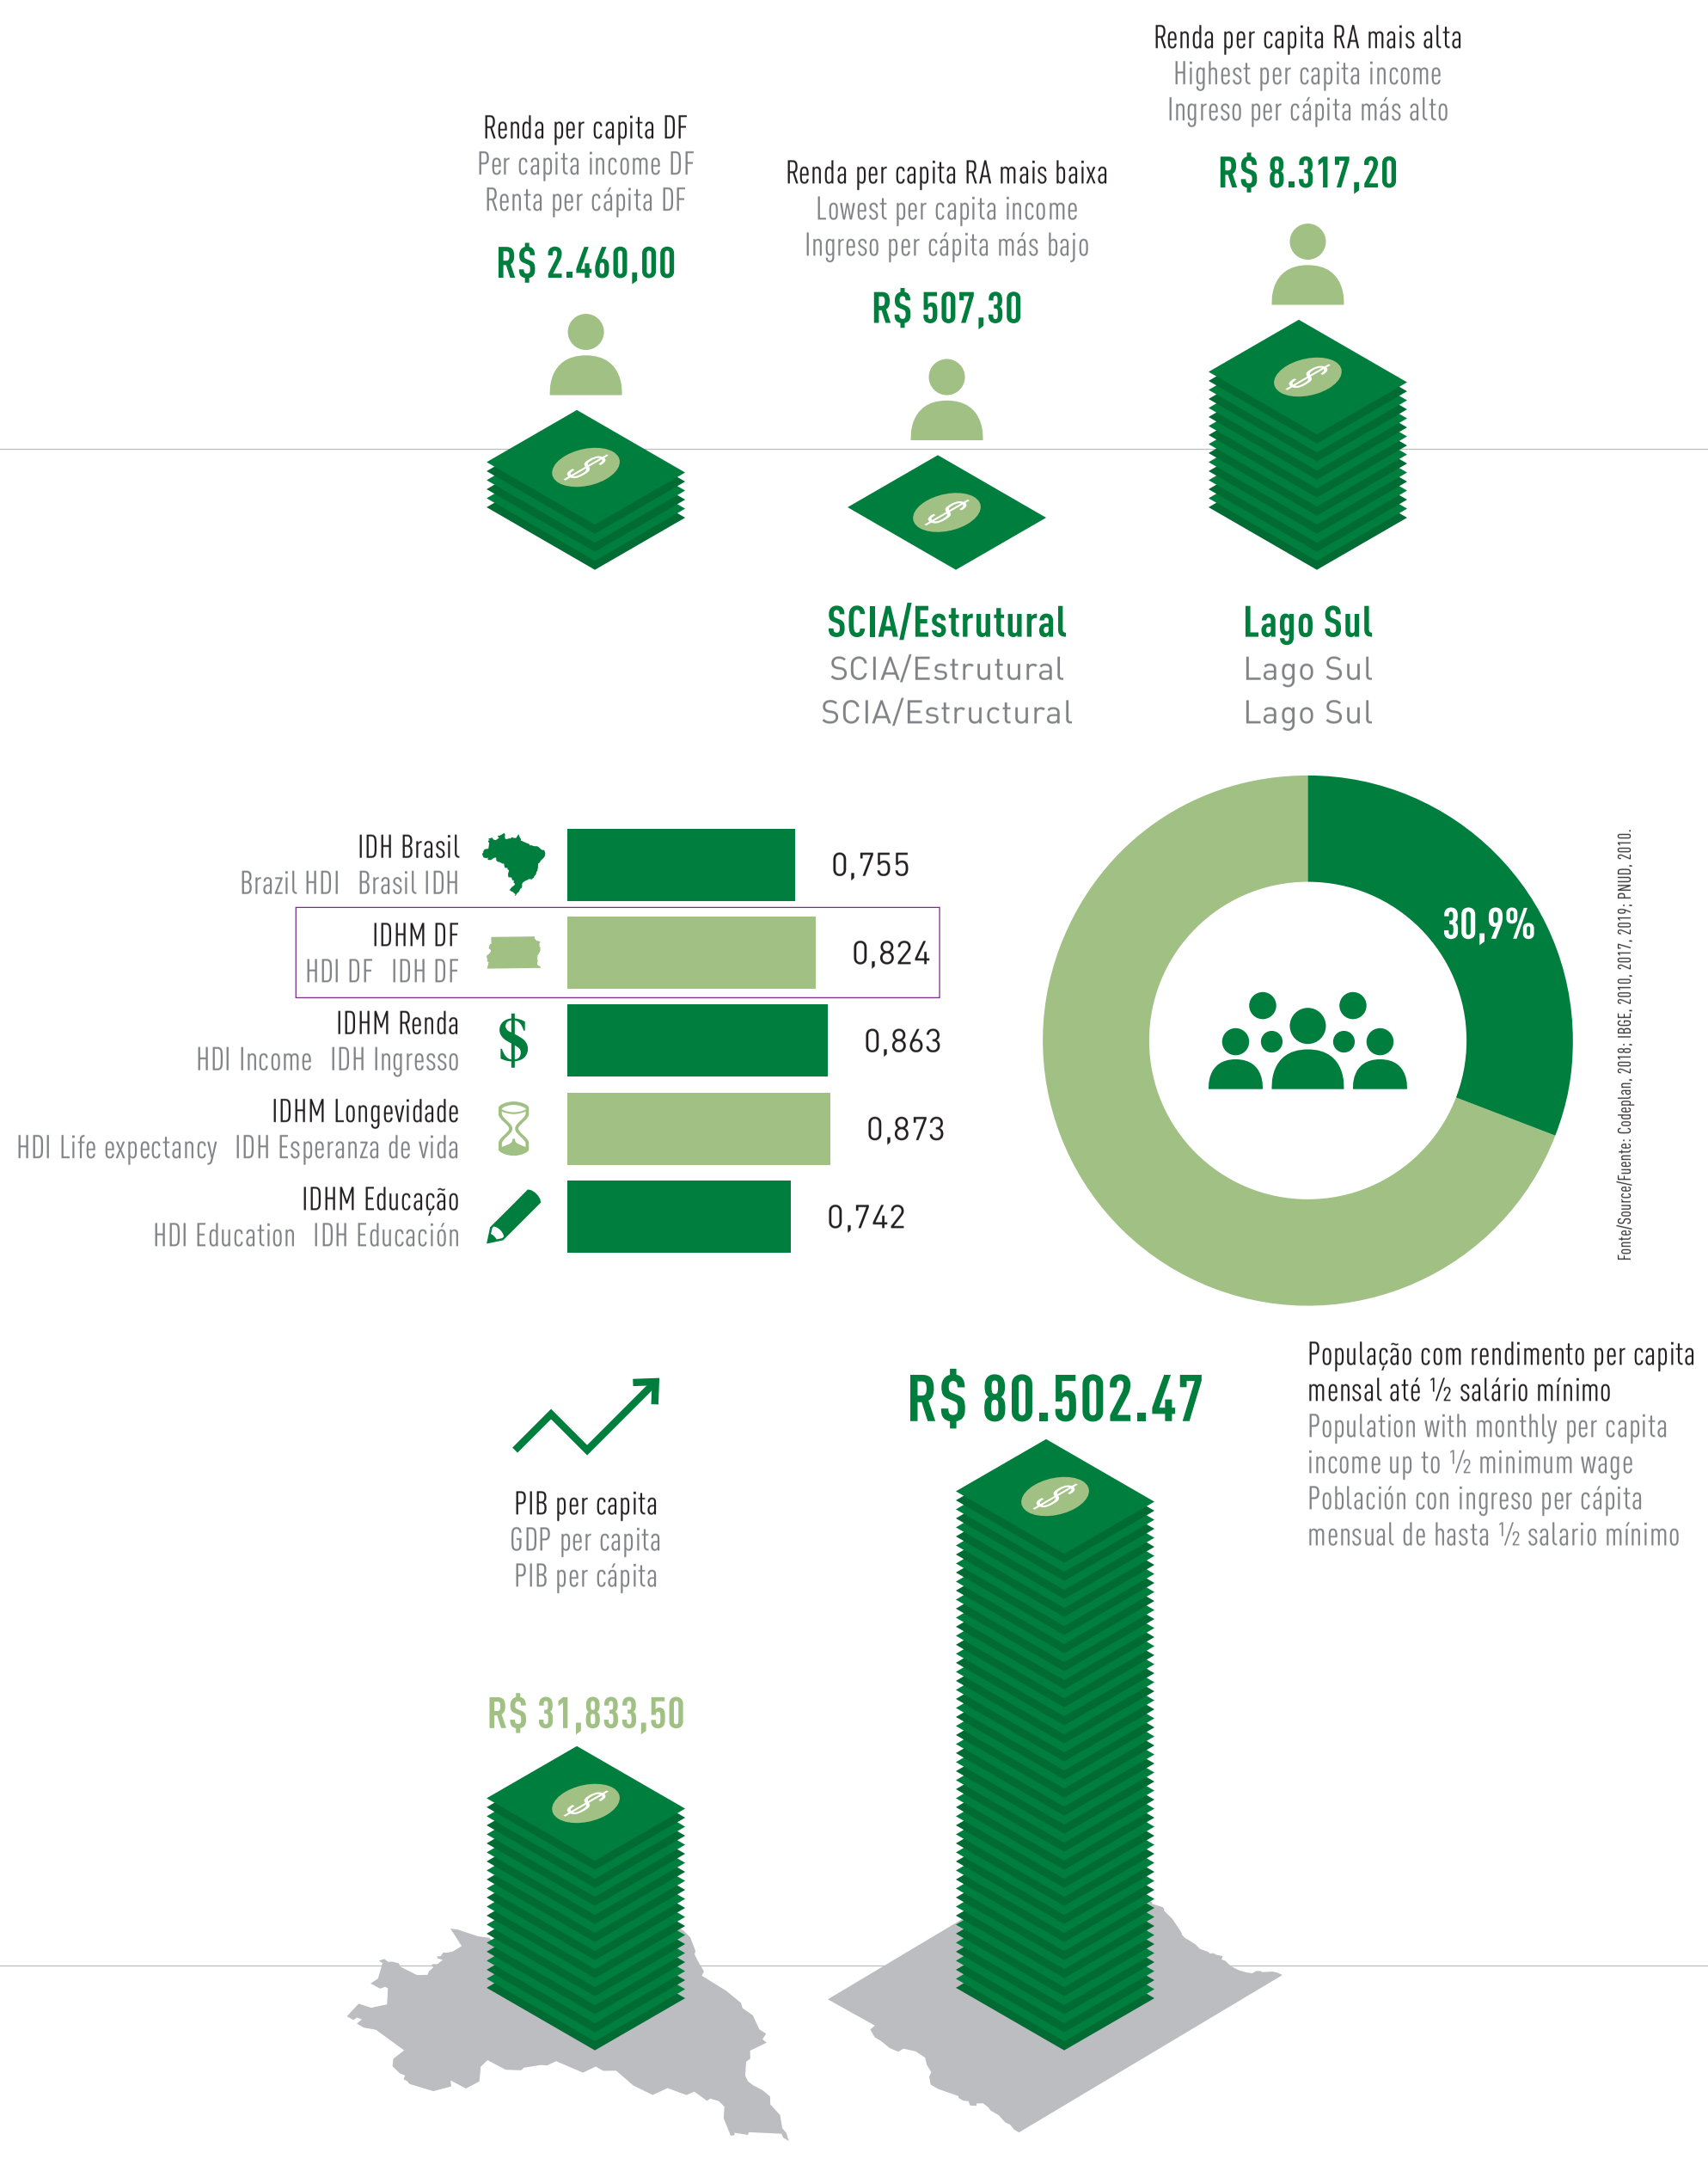
The Federal District, besides being the political center of Brazil, is also an important economical center, having the eighth largest gross domestic product – GDP among the federation units and the greatest per capita GDP in Brazil. The average monthly income per capita is 2,460 reais, the greatest among all of the federal units. In the income dimension of the Human Development Index – HDI, the Federal District has the eighth largest among Brazilian municipalities. Considering the total HDI, the Federal District occupies the ninth position among 5,565 municipalities. These characteristics make the Federal District an important consumer market, with great development potential. However, there is great social inequality in the Federal District, characterized by the variation of income distribution among the Administrative Regions. The economy of the Federal District is quite diverse, but due to its administrative function, the services sector is of great importance, holding the largest participation in the GDP and occupying the great majority of the economically active population. The activities of administration, education, health, public research and development, defense and public safety are what stand out.

 Figure 38 - Federal District (2017) gross value economic sectors participation
Figure 38 – Federal District (2017) gross value economic sectors participation
 Figure 39 - GDP (2017) service sector activities participation
Figure 39 – GDP (2017) service sector activities participation
 Figure 40 - Brazil and Federation Units GDP ranking per capita (R$) (2017)
Figure 40 – Brazil and Federation Units GDP ranking per capita (R$) (2017)
 Figure 41 - Federation Units GDP participation ranking (%) in Brazil GDP (2017)
Figure 41 – Federation Units GDP participation ranking (%) in Brazil GDP (2017)
 Figure 42 - Federal District (2018) Economically Active Population participation rate (PEA)
Figure 42 – Federal District (2018) Economically Active Population participation rate (PEA)

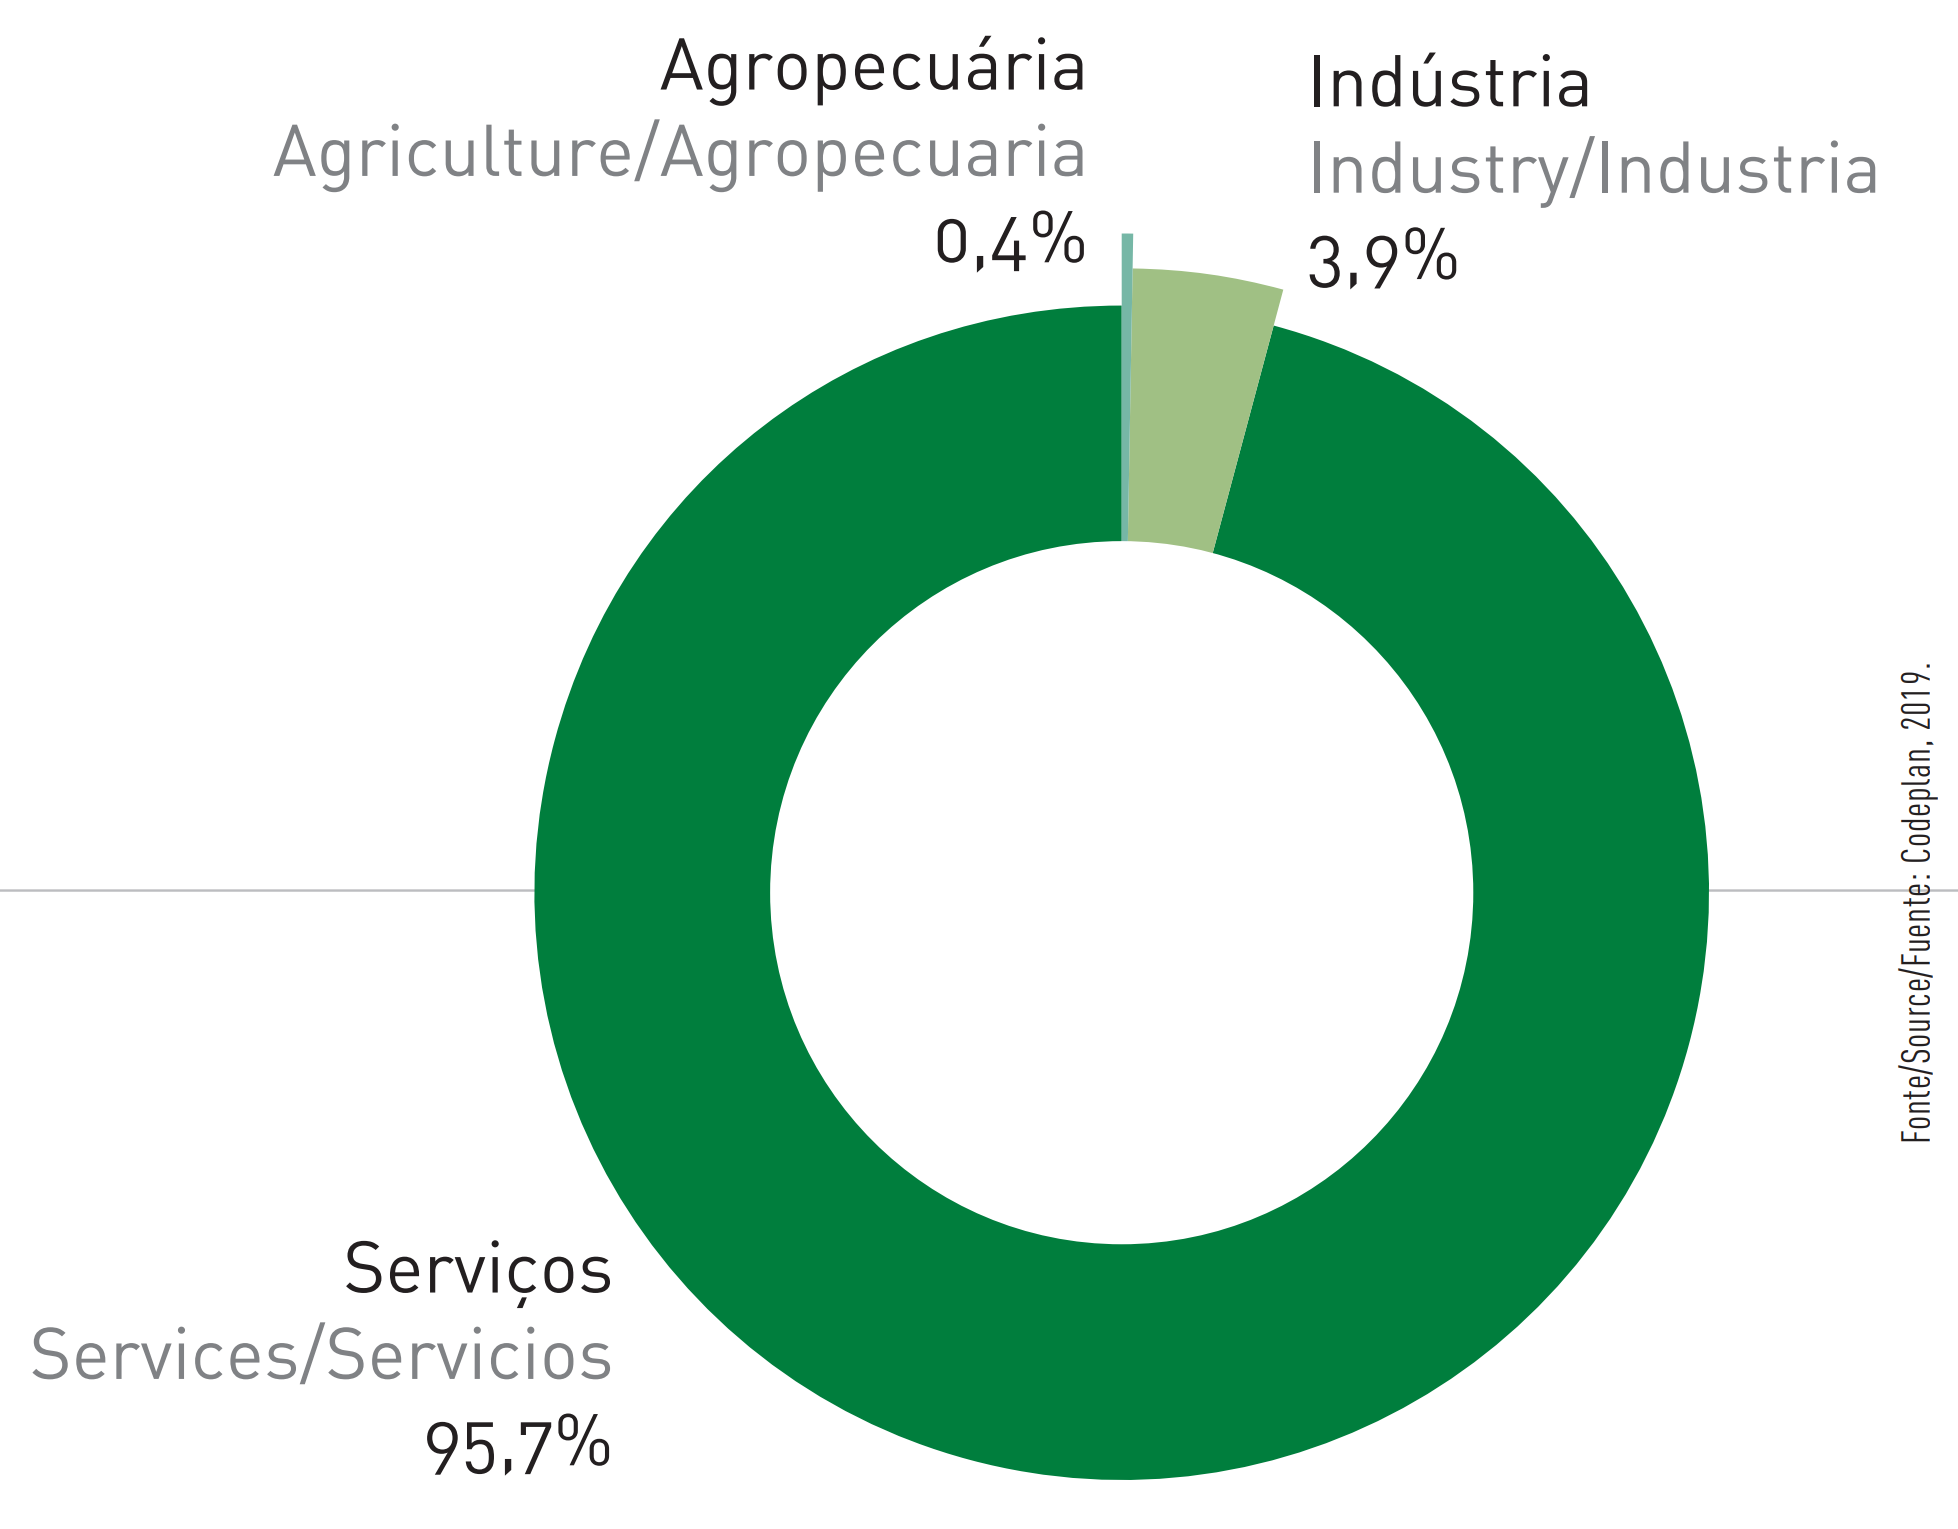
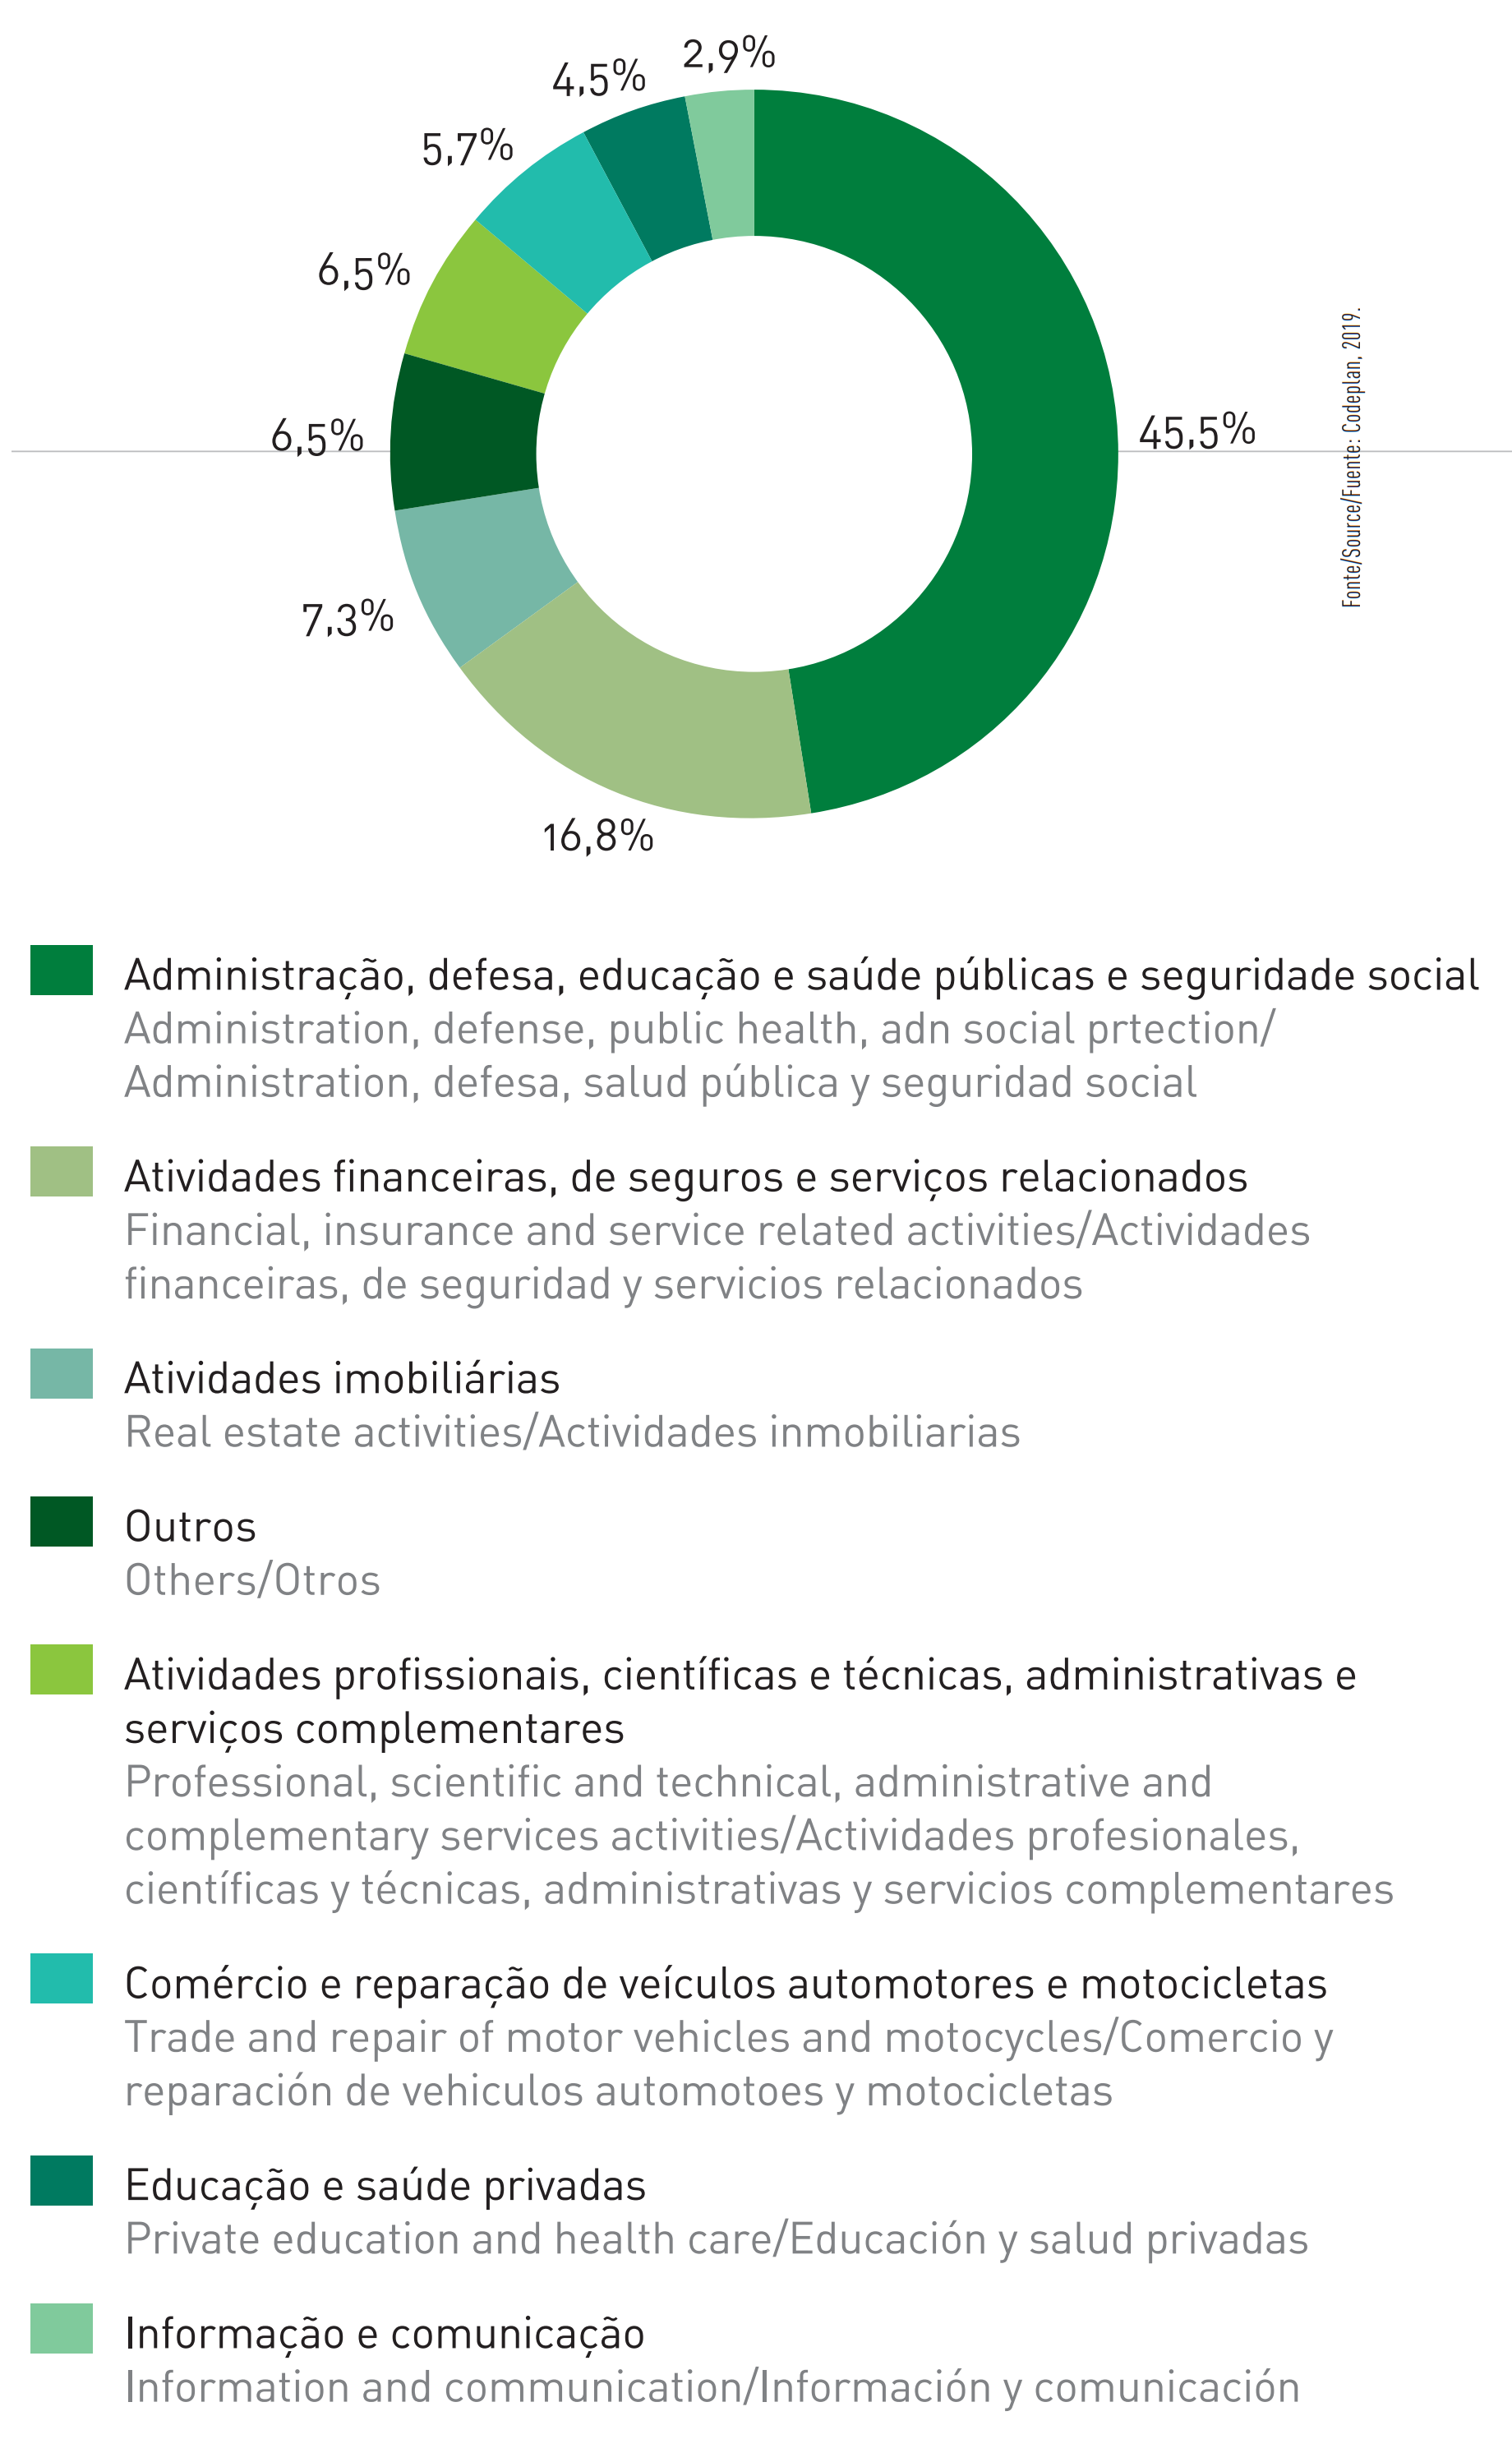
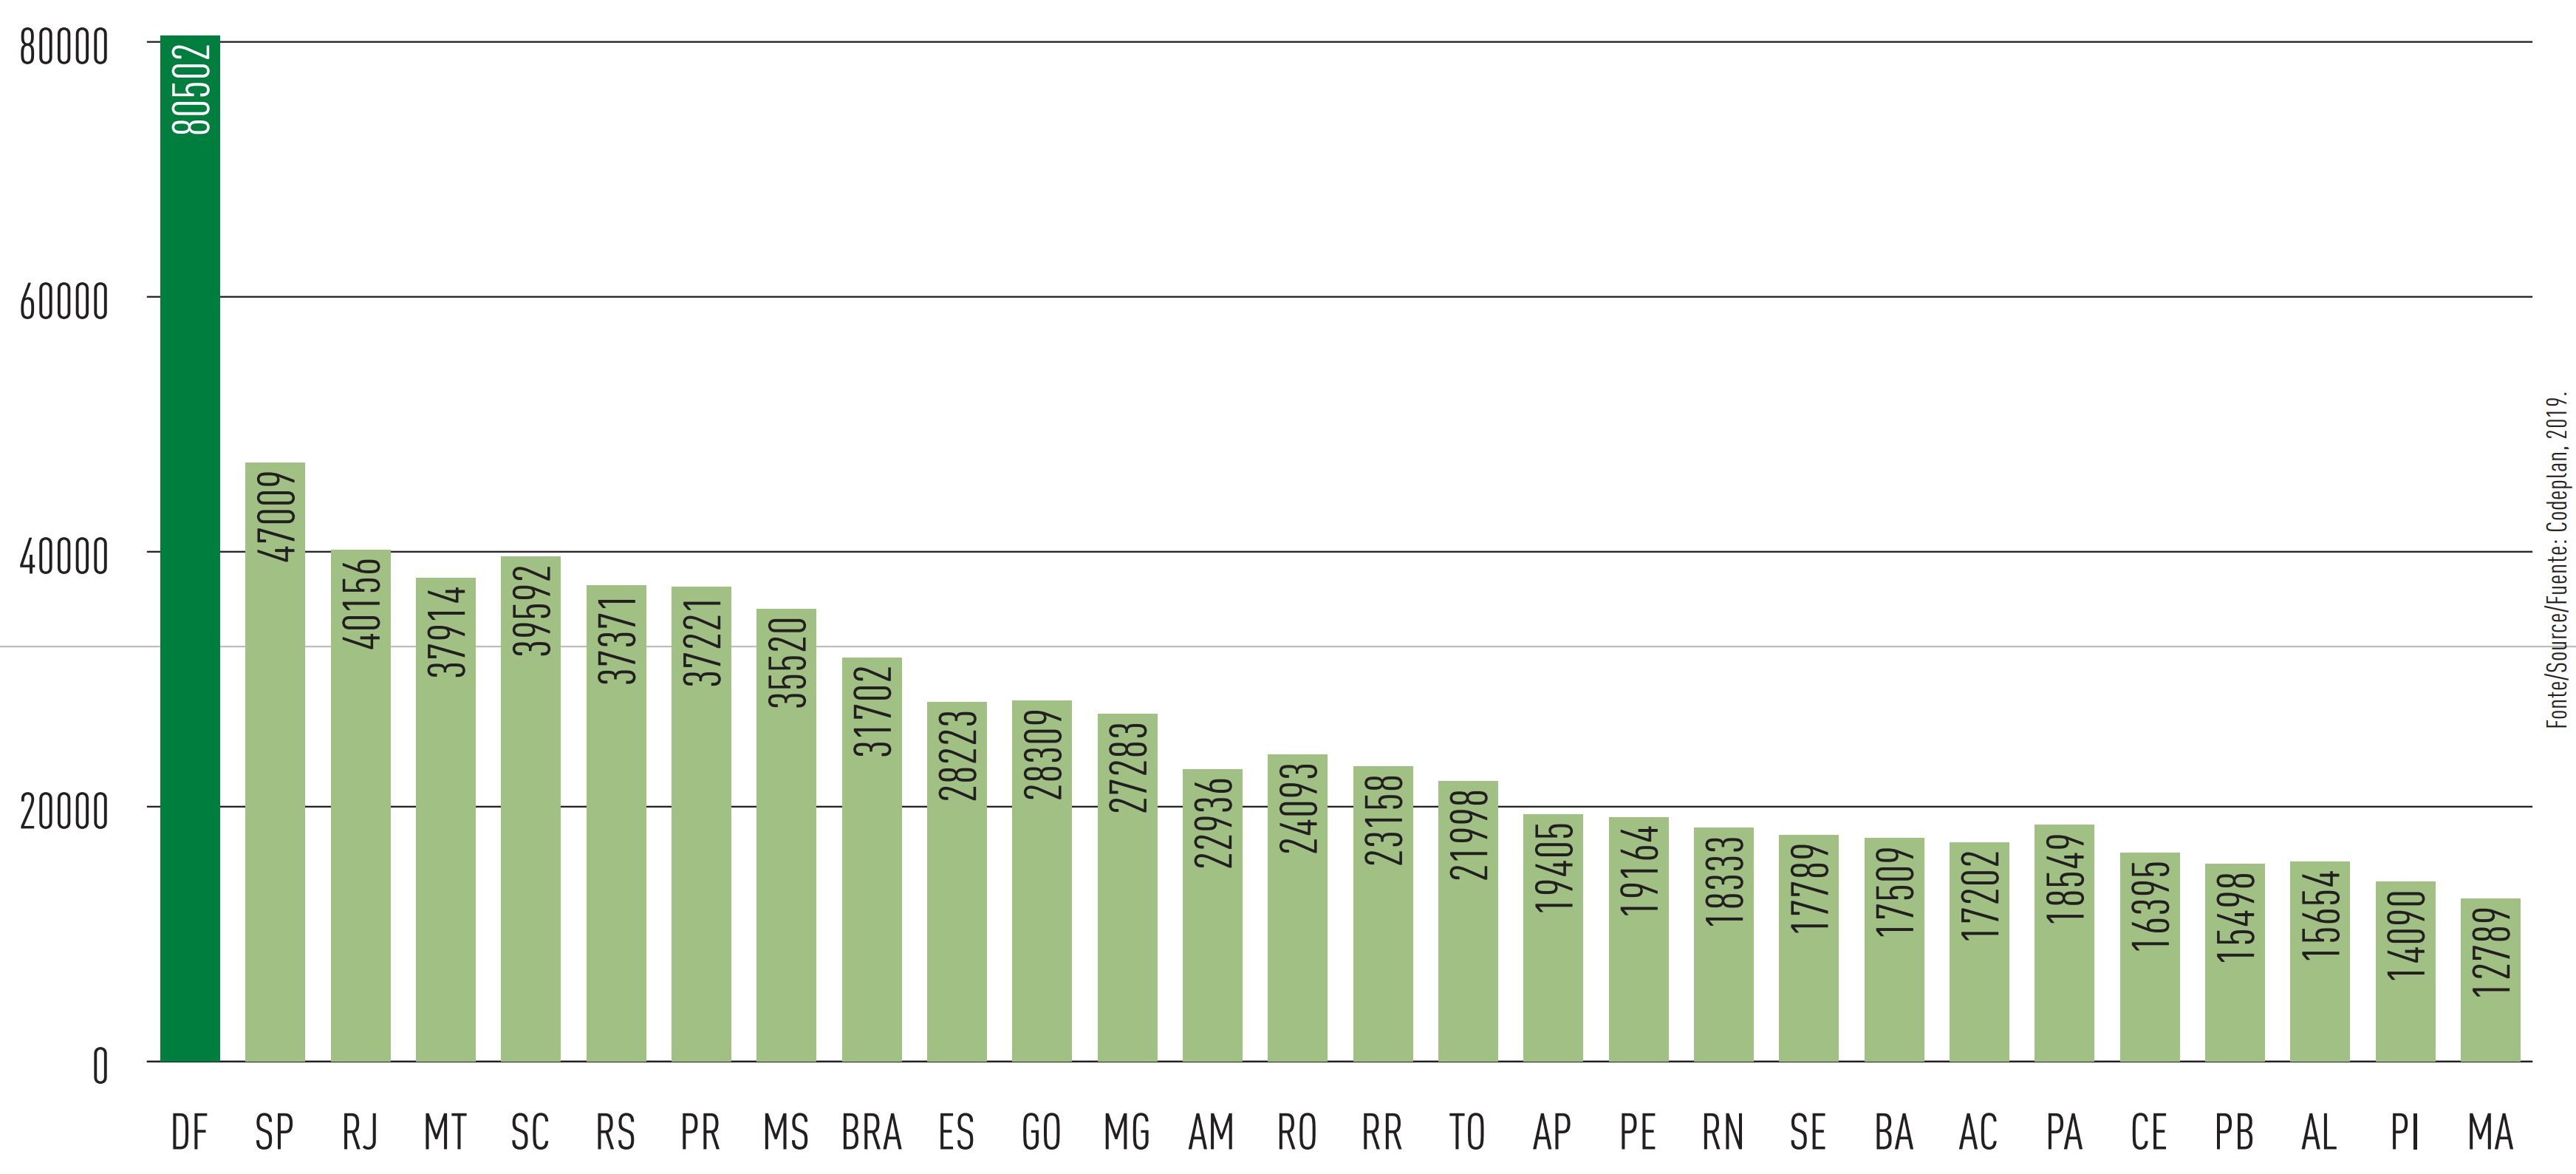
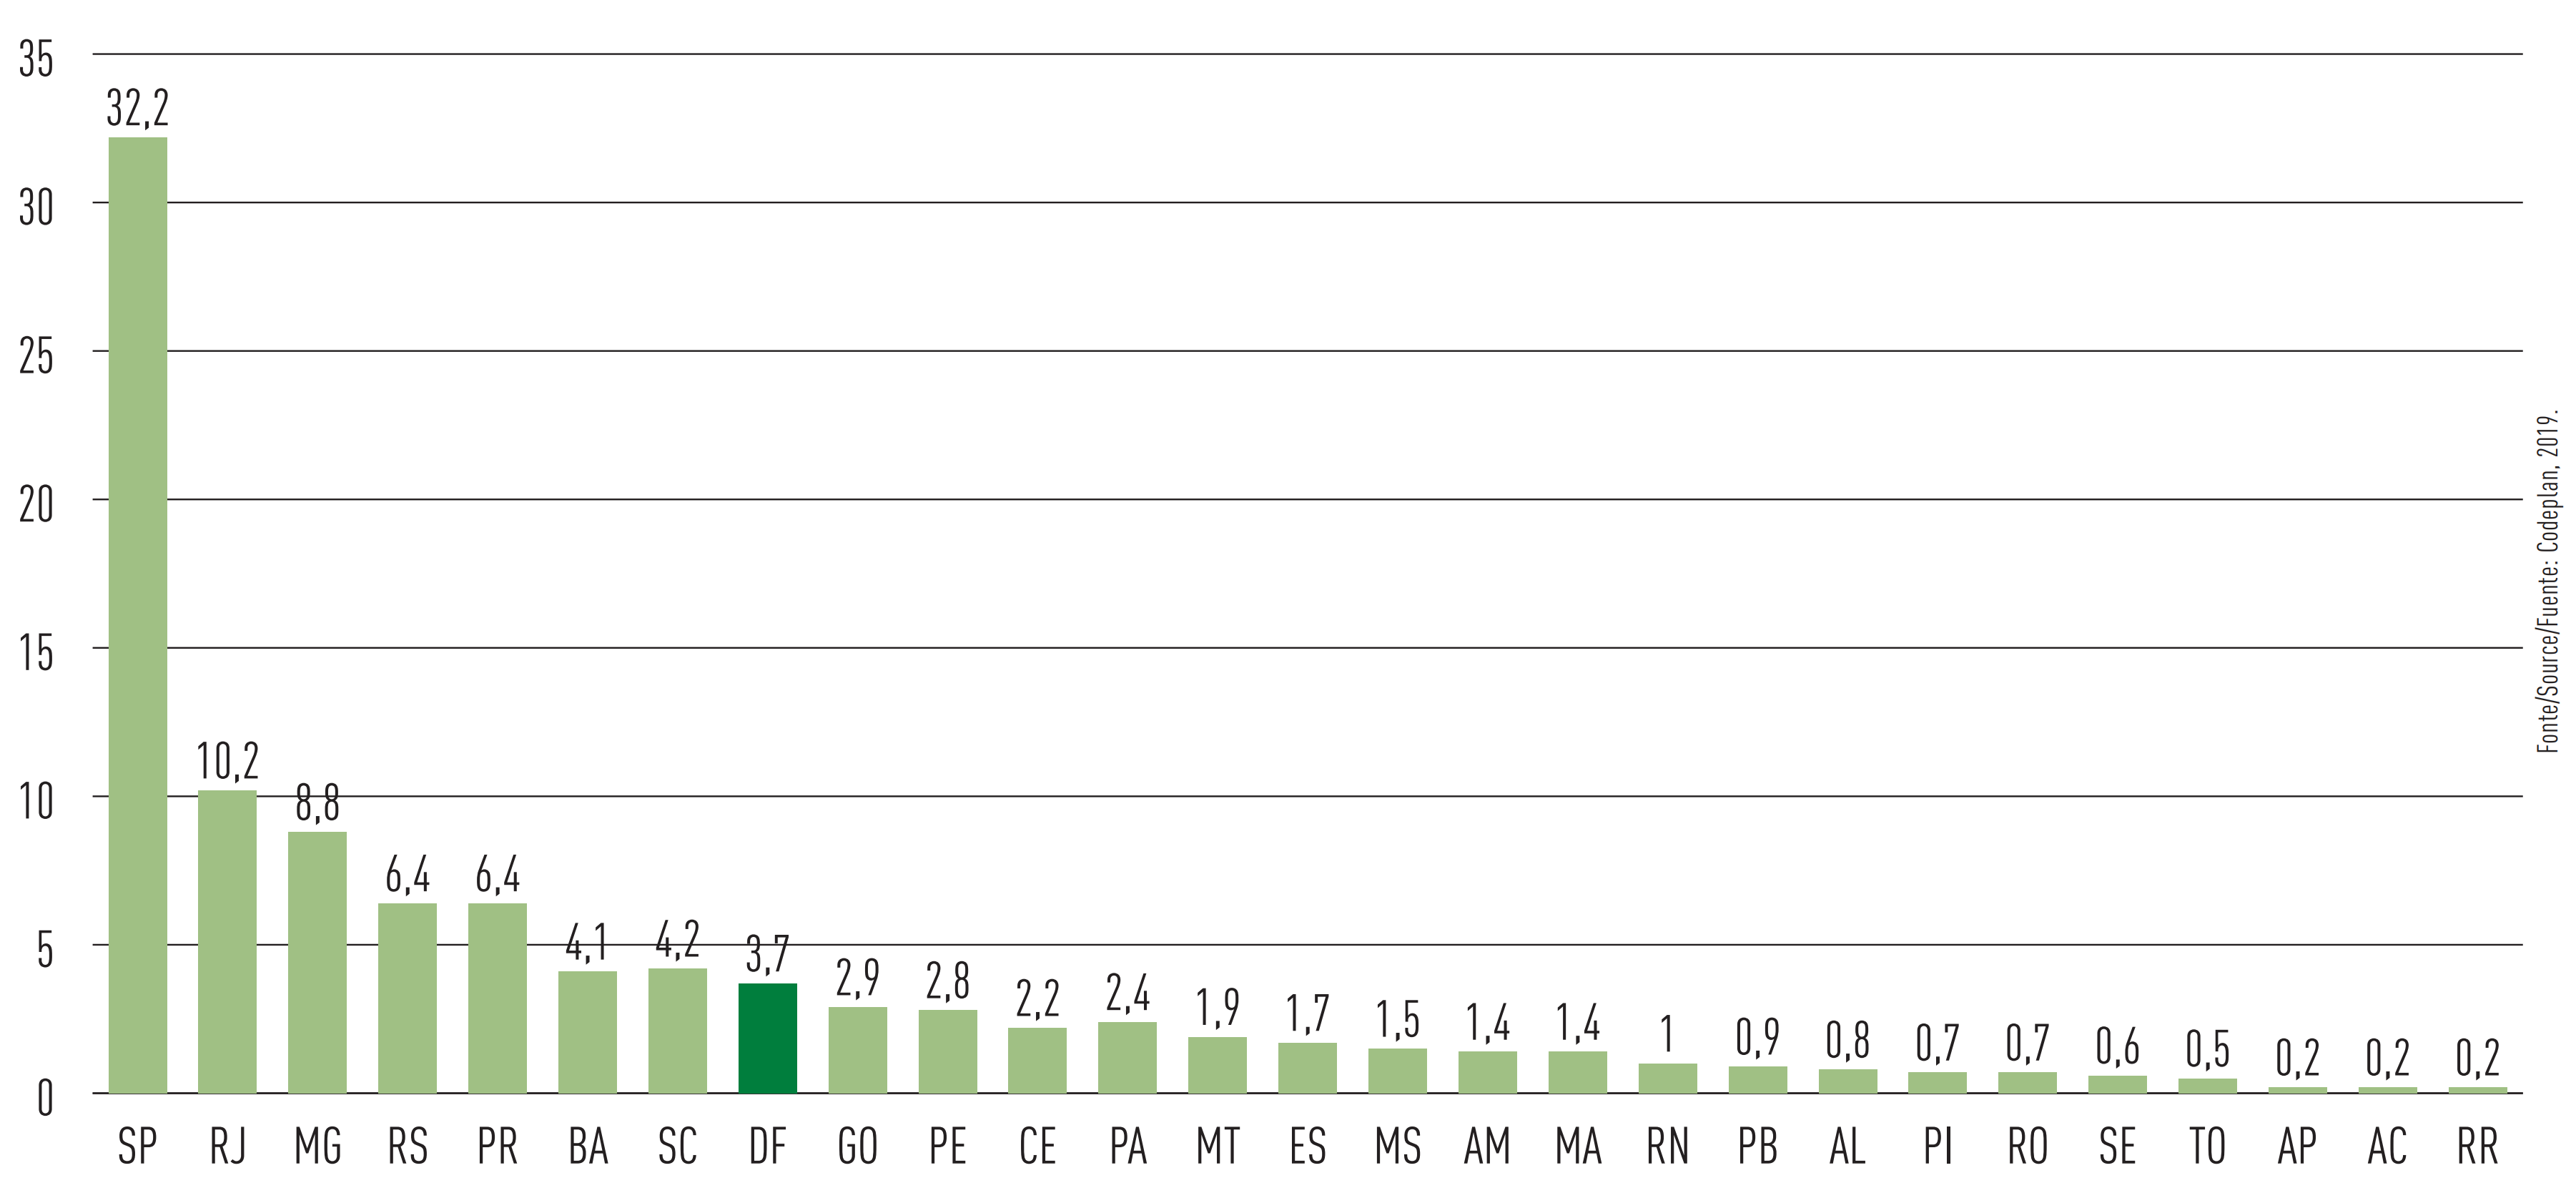
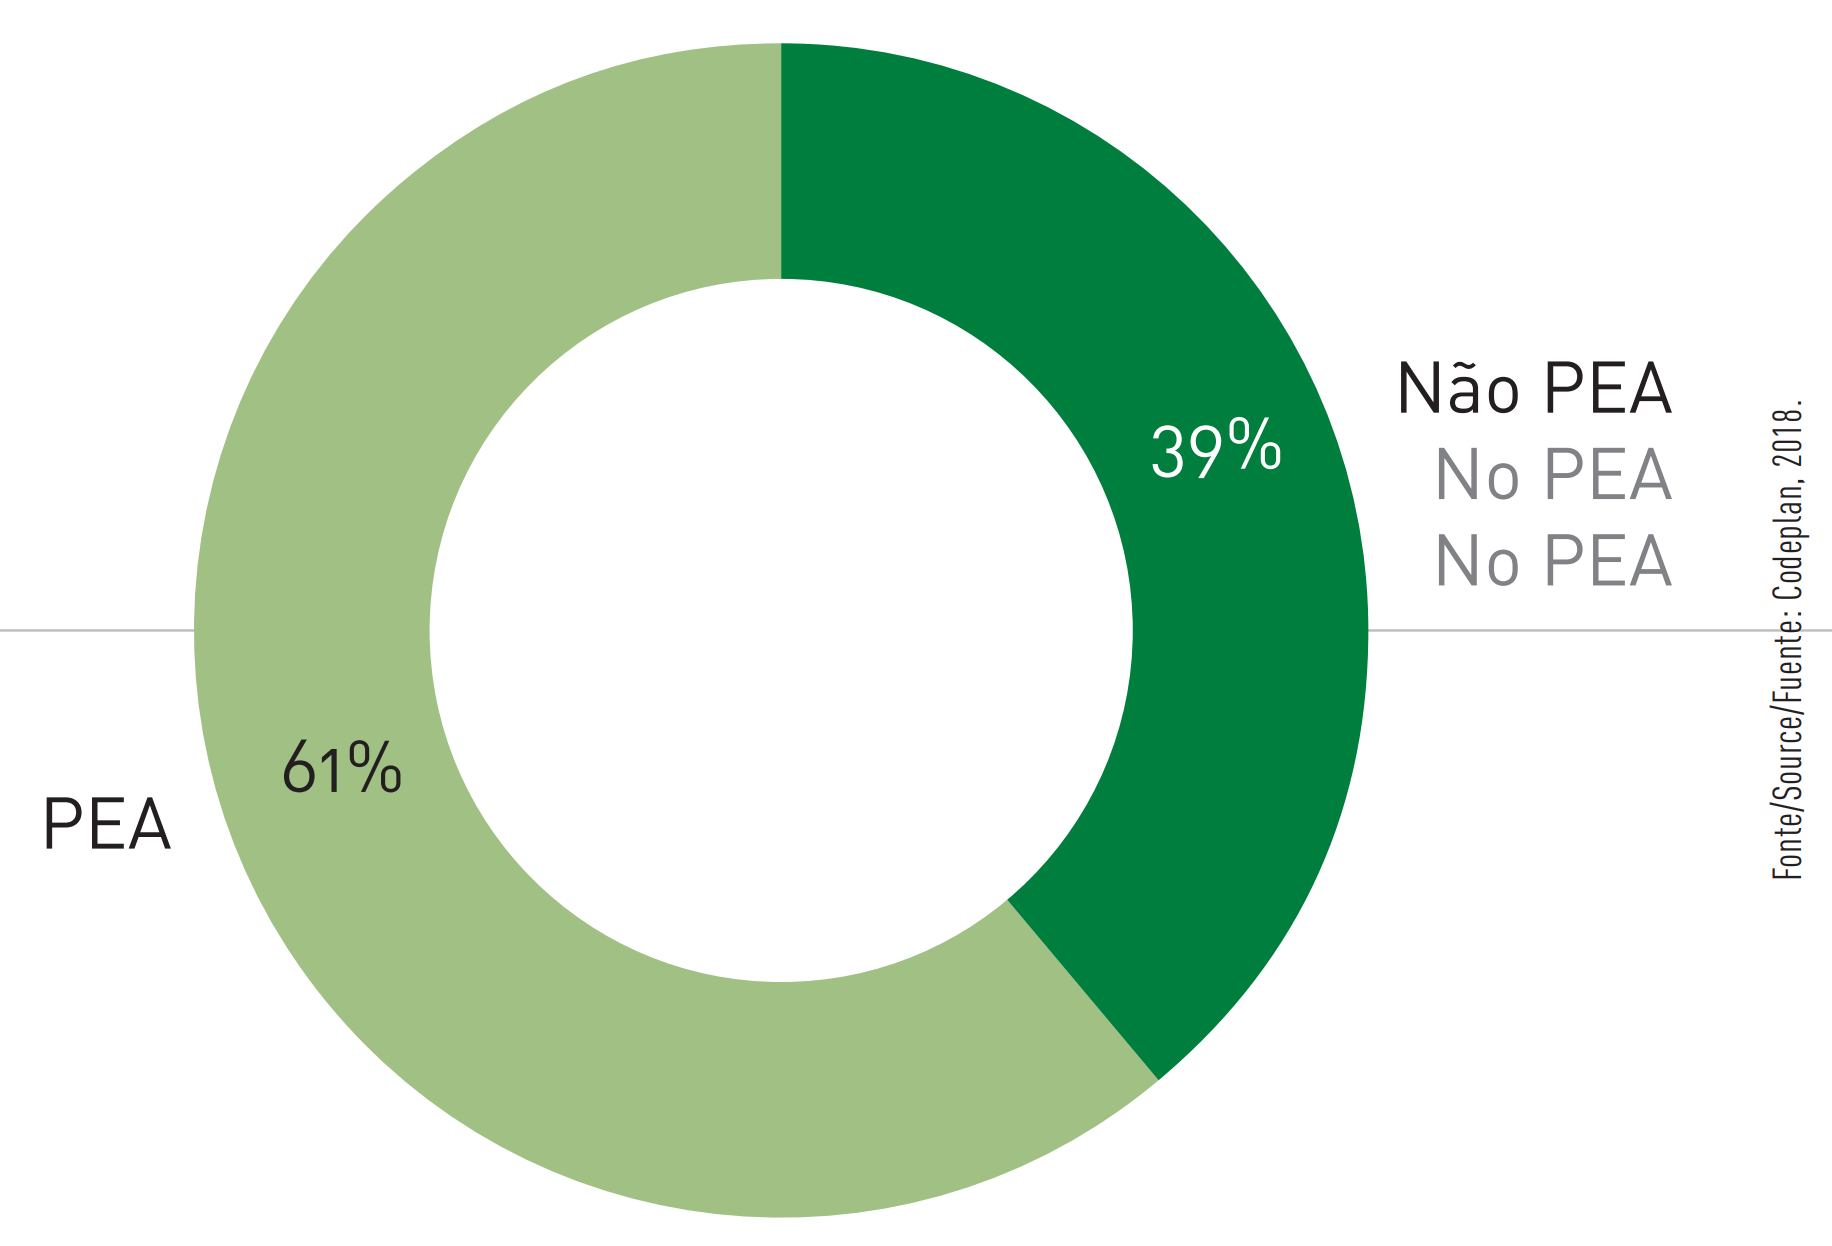
Figure 43 – Household income per capita by Administrative Region

 Figure 44 - Federal District (2018) working population by economy sector
Figure 44 – Federal District (2018) working population by economy sector
 Figure 45 - Federal District (2018) percentage of workers with a work document record (registered)
Figure 45 – Federal District (2018) percentage of workers with a work document record (registered)
 Figure 46 - Federal District (2018) INSS contributing workers percentage
Figure 46 – Federal District (2018) INSS contributing workers percentage
 Figure 47 - Federal District transportation means used to go to work
Figure 47 – Federal District transportation means used to go to work
 Figure 502 - Renda
Figure 502 – Renda